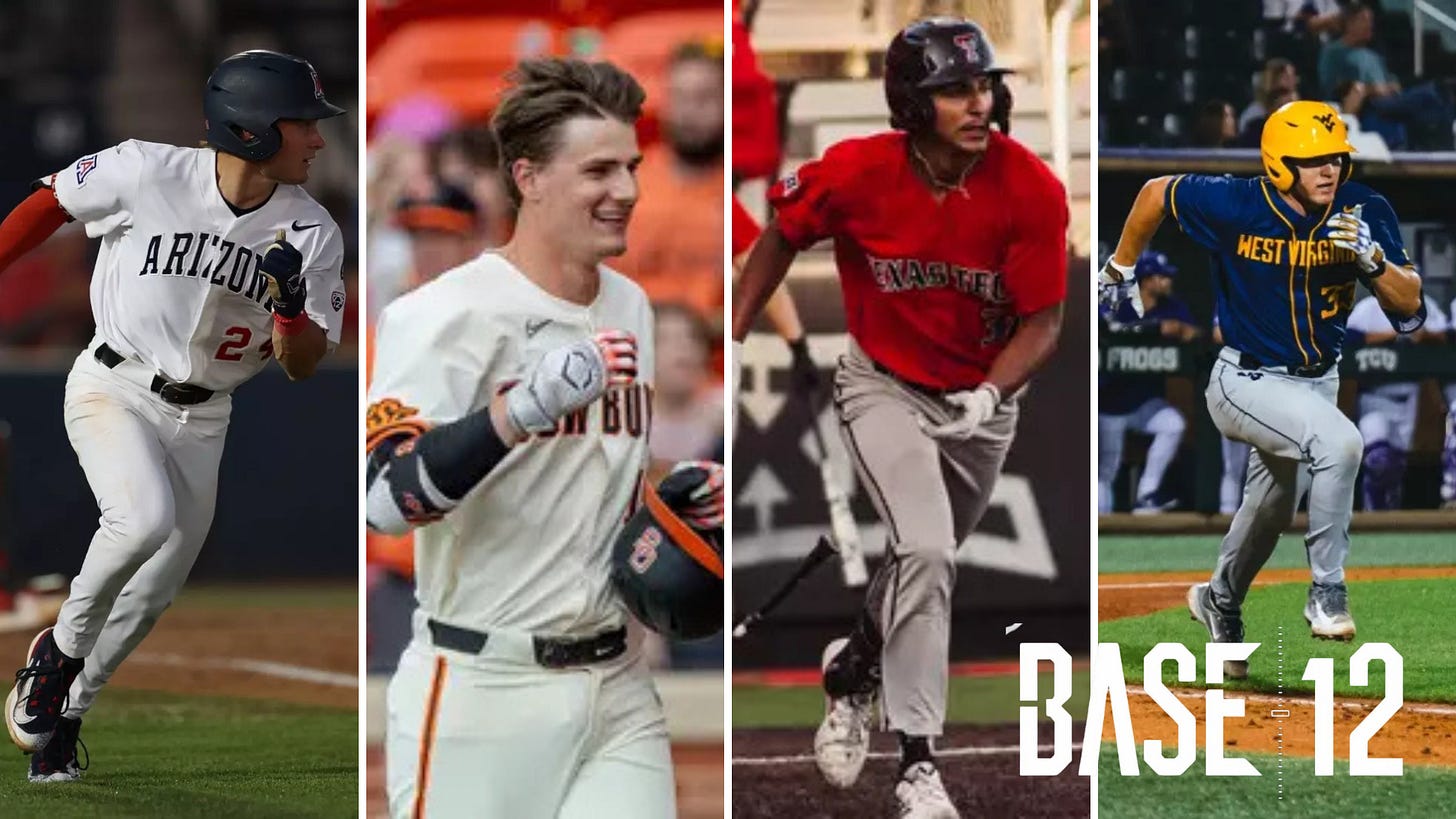
Big 12 Returning Hitters Sorted by WAR
Who returns the most productive players in the conference in 2025?
One of the biggest challenges year over year is attempting to project how good (or less good) a team will be before they ever throw a pitch or take an at bat.
No approach to attacking this challenge gives us a crystal ball, but Bill Connelly’s work over the last decade-plus has shown us that returning production—both in quality and amount—is as good a starting point as any.
That’s what we’re doing here, in several parts. The first is returning production at the plate, which we’ll look at today. Next we’ll look at returning pitching, before turning to transfer portal acquisitions and finally, the most “paper tiger-y” group, the freshmen classes.
As a starting point, I wrote some rudimentary scripts in R Studio, scraped The Baseball Cube for all of last year’s hitting data, filtered for returning players, and calculated a rough version of WAR (wins above replacement).
Trying to calculate WAR at the college level by simply using MLB standards would have been foolish, so I tweaked a few things to try and get a more accurate depiction of the talent swings we see in college baseball, even within a single conference.
We’ll work off the standard method for calculating WAR. Beginning with calculating wOBA, then finding wRAA, and lastly calculating WAR.
Where I deviated was by adjusting the constants (league wOBA, wOBA scale, runs per win) and the fielding positional values slightly (players tend to be more position-transient depending on the roster and team situation). I’ll continue to tweak those over the course of the season if things feel wonky or out of balance.
This was the result (play around with this format and let me know if you have any feedback):
It’s always a good sign with the Big 12 Preseason Player of the Year is at the top of your “most productive returning players” list, so that was nice to see.
Schubart headlines a strong returning core for Oklahoma State, which gives us a good sense of why they are the preseason favorites to win the conference.
Two schools that stand out in this exercise are Arizona State and Baylor. The Sun Devils and Bears were picked sixth and 13th, respectively, in the Big 12 preseason poll. However, both return multiple top 20 players. So why are pundits lower on them than, say, Texas Tech?
Here’s where we begin parsing out volume vs. quality production. Arizona State only has six returning contributors, raising questions about overall roster construction and how they’ll be able to integrate newcomers. Baylor returns 12, but after Enzo Apodaca at No. 19, only two more Bears appear in the Top 50.
For comparison, Arizona returns 11 contributors from a season ago, including three in the Top 15 for WAR.
An interesting question is TCU. The Horned Frogs were picked to finish third in the league, but they lost their top three hitting contributors from last season according to this WAR calculation and only return seven contributors, just one of whom appears in the Top 30 in this list (No. 27, Sam Myers).
Why are folks so high on the Frogs? I think we’ll get our answer during the pitching and freshman class portions of this conversation. Same goes for several other schools, but this is the first piece of the puzzle when it comes to evaluating Big 12 baseball programs as we approach the 2025 season.


